
Client
theplaydistrict.com
Industry
Family activities and local media
Country
United States

The Play District® is a family activities guide for parents in the American Southwest. It curates places to go and events to attend, organised by market and by neighborhood, so a parent can answer one question fast: what can we do with the kids this weekend.

It covers three markets today, Tucson, Phoenix and San Diego, with 1,018 listings, 1,036 published events, and more than 600 registered parent accounts.

The business model makes digital friction expensive. Local businesses pay to appear in the guide and to promote events inside it, so the catalogue is the product they buy. When a parent cannot find the events page, or the calendar shows last year's dates, the visit that business paid for never happens. Enough lost visits are a subscription that does not renew.
The challenge: a site that grew one market at a time

  1. Every new market meant rebuilding the site. Each city carried its own home page, six category pages, events listing, handbooks page, and CMS collections. Tucson events lived in one collection, Phoenix events in a second with a different name. San Diego had a "coming soon" link because opening it meant producing that set again by hand.
  2. The events catalogue was hard to reach and outdated. The home page header had no link to events or to the directory; reaching them took at least three clicks along a counterintuitive path. A parent who got to the Tucson events page found 15 events, every one dated 2023, with no pagination and no filter for past dates. The event page held a single date field, so a class running every Tuesday and Saturday showed only one Saturday, and offered no add to calendar, share or ticket link. Event pages also had serious SEO gaps: no meta description, canonical tag, or structured data.
  3. Performance failed on the device parents use. On mobile, the Webflow home page scored 34 out of 100, blocked the main thread for 1,800 ms, and moved its layout by 0.211. Images alone carried an estimated 7,907 KiB of avoidable weight on mobile and 13,628 KiB on desktop.

The process: four phases, each one shipped to production

  • Discovery and data modelling. The Webflow collections and the Xano entities behind them were inventoried and folded into one relational schema. Fixing the geography on the product's own terms, where a district is a market and a neighborhood is an area inside it, is what lets one route set serve any number of cities.
  • Prototype against the three personas. Parent, Business and Admin flows were built first against local data, so the client could review them screen by screen before any schema was completely defined.
  • Development in four phases. Public site, parent dashboard, business dashboard with Stripe billing, admin console. Each landed in its own environment through three Cloudflare Workers, one per branch, so the client could test staging while development continued.
  • QA as a build gate. Unit tests cover the query, billing and marketing layers, and end-to-end flows run in Playwright with automated accessibility checks. We also ran manual testing with the team and the client to verify the most critical flows and confirm the look and feel of the platform.
  • Cutover by runbook. The Xano data, the images, the Stripe billing state, and the domain each had a written runbook. Legacy Webflow addresses were mapped to permanent redirects first, so search ranking followed the content across. The domain moved on 24 August 2026.
  • Support after launch. A daily job lands scheduled plan changes at renewal, a second emails the team about unresolved errors, and failed Stripe webhook events are retried instead of being lost. An internal channel with the client collects any bug a user finds, so it can be prioritised and solved.
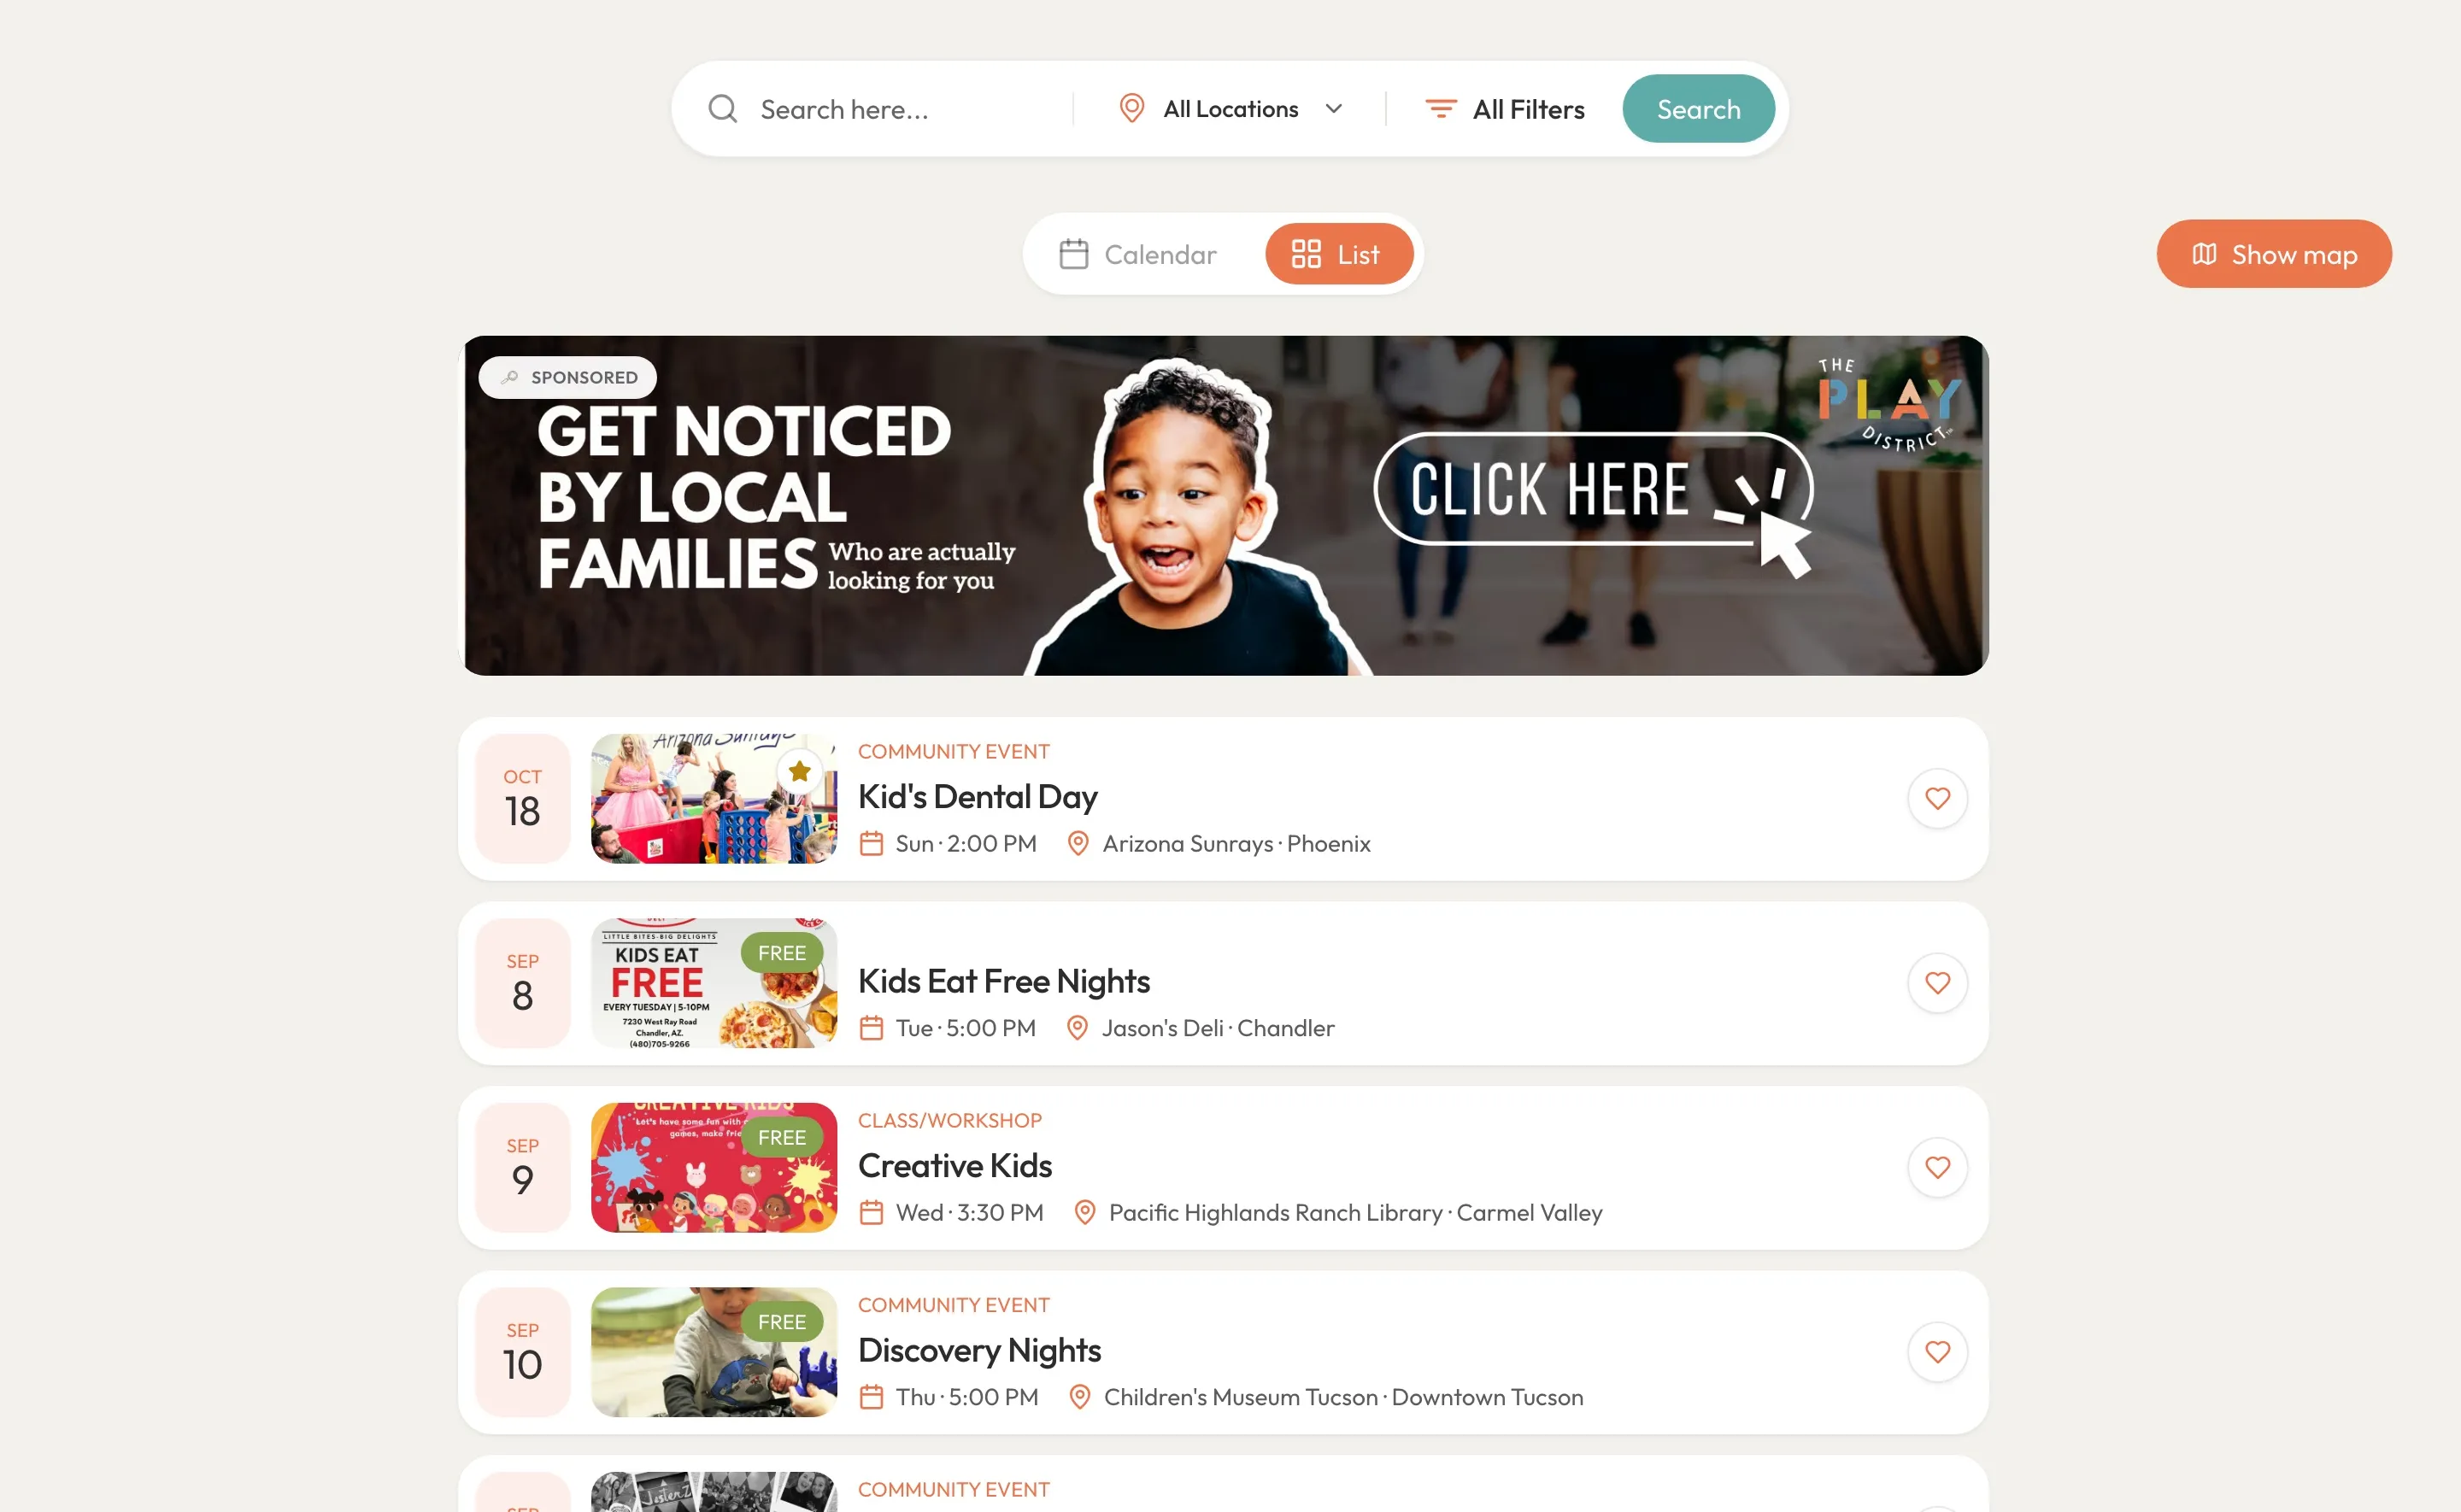
The Play District events explorer on the new platform, with list, calendar and map views for a single market

The solution: one route set, one schema, three markets

We rebuilt The Play District® as a single platform where a market is data, not a copy of the site. Every layer is owned code:

  1. Frontend layer

    Next.js 14 on Cloudflare Workers, through OpenNext

    App Router and React Server Components. The home page is statically prerendered, and the middleware skips session work for anonymous requests, which keeps first loads inside the Worker CPU budget.

  2. Data layer

    Supabase Postgres with row-level security on every table

    The public explorer reads one denormalized view unifying places and events, with taxonomy and search text already aggregated, so a listing grid is one query.

  3. Billing layer

    Stripe subscriptions, campaigns and marketing add-ons

    A signed webhook reconciles every event into the business record.

  4. Image pipeline

    WebP in the browser, AVIF or WebP at the edge

    Uploads are re-encoded to WebP and capped at 2560 px on the longest side before storage. Delivery runs through Cloudflare Image Transformations, which negotiates the format per request.

  5. Internal CMS

    A purpose-built admin console in place of the Webflow editor

    Content, business CRM, claims, ads and users, with image cropping, bulk CSV import with geocoding, and an audit trail on every action.

What the rebuild added

  • One search bar across every market. A directory of more than 1,000 published listings on a single page with eight in-page categories, in place of six pages per city.
  • Events as a list, a calendar, or a map. Each event detail page now offers save, share, add to calendar, directions, and a ticket link.
  • Self-serve for business owners. They can claim their listings, subscribe and run campaigns on their own.
  • Accounts for parents. Favourites that persist and a public profile page.
  • A complete admin module, built from scratch. It lets the client manage a growing number of users, businesses and events with ease, including a customised batch upload for adding them in bulk.
"Low-code tools stay efficient until a product needs a second copy of itself. From then on, duplication is the roadmap."

The Play District case study

Previous Webflow site vs production, August 2026

The impact: 98/100 on desktop and no layout shift on either device

Performance was measured on the home page of both sites with PageSpeed Insights and Lighthouse 13.4.1 on 25 August 2026, once on the emulated desktop profile and once on an emulated Moto G Power under slow 4G throttling. Each run is a single page session on a first load.

MetricPrevious Webflow siteCurrent productionNet improvement
Lighthouse performance, desktop61 / 10098 / 100+37 points
Lighthouse performance, mobile34 / 10082 / 100+48 points
Total blocking time, desktop1,200 ms50 ms96% lower
Total blocking time, mobile1,800 ms200 ms89% lower
Cumulative layout shift, desktop0.0960Eliminated
Cumulative layout shift, mobile0.2110Eliminated
First contentful paint, mobile3.4 s1.7 s50% faster
Largest contentful paint, mobile4.4 s3.8 s14% faster
SEO score, both devices82 / 100100 / 100+18 points

Key wins

  • The main thread stops blocking (1,800 ms to 200 ms on mobile). Taps register when a parent makes them, instead of queueing behind almost two seconds of script work.
  • Layout shift reaches zero on both devices (0.211 and 0.096 to 0). Cards no longer move while the page loads, which removes the mis-taps that sent parents to the wrong listing.
  • Avoidable image weight drops from megabytes to kilobytes. Estimated savings fall from 13,628 KiB to 140 KiB on desktop and from 7,907 KiB to 62 KiB on mobile.
  • The catalogue becomes indexable (SEO 82 to 100). Each event carries its own title, description, canonical tag and structured data.
Desktop Lighthouse performance, up from 61.
98/100
Lower total blocking time on desktop: 50 ms, down from 1,200 ms.
96%
Cumulative layout shift on both mobile and desktop, down from 0.211 and 0.096.
0
Markets served from a single route set: Tucson, Phoenix and San Diego.
3

Our commitment: paid on what the platform earns

Part of the fee for this project is variable and tied to the new business subscriptions the platform brings in after launch. If a subscription stops, that share stops with it.

The arrangement puts the engineering team on the same side of the table as the client: a listing that subscribes to a paid tier is worth something to us too, and a feature nobody uses is not.

Key takeaway: a site per market is a growth ceiling

Low-code tools stay efficient until a product needs a second copy of itself. From then on, duplication is the roadmap: every new market costs another build, and every fix is applied once per city. The Play District reached that ceiling at two markets and opened a third within weeks of the rebuild.

When a low-code stack starts to slow a growing product down, the first useful step is not a migration. It is an architecture review that says what the current stack still does well, what it costs to keep, and which parts should move first. Produlis runs those reviews without disrupting live operations.

Have a stack outgrowing itself?

Book a call and we'll walk you through how we'd approach your platform, priced fairly and estimated for real.